Python实现线性回归与批量梯度下降法完整示例

发布时间:2026-10-13 |
2人浏览过
本文详细介绍如何使用Python实现线性回归及批量梯度下降算法。通过自定义dataMinning类,演示了数据读取、模型训练及参数更新过程。文章包含误差迭代曲线与数据散点拟合直线的可视化代码,帮助开发者理解批量梯度下降在简单线性回归中的应用与实现细节。
基于斯坦福大学公开课中关于线性规划与梯度下降的理论内容,参考现有代码进行了实测,并封装为一个类以便后续扩展。目前代码注释尚未完善,因近期作业较多暂且搁置。
import numpy as np
import matplotlib.pyplot as plt
import random

class dataMinning:
  datasets = []
  labelsets = []

  addressD = '' #Data folder
  addressL = '' #Label folder

  npDatasets = np.zeros(1)
  npLabelsets = np.zeros(1)

  cost = []
  numIterations = 0
  alpha = 0
  theta = np.ones(2)
  #pCols = 0
  #dRows = 0
  def __init__(self,addressD,addressL,theta,numIterations,alpha,datasets=None):
    if datasets is None:
      self.datasets = []
    else:
      self.datasets = datasets
    self.addressD = addressD
    self.addressL = addressL
    self.theta = theta
    self.numIterations = numIterations
    self.alpha = alpha

  def readFrom(self):
    fd = open(self.addressD,'r')
    for line in fd:
      tmp = line[:-1].split()
      self.datasets.append([int(i) for i in tmp])
    fd.close()
    self.npDatasets = np.array(self.datasets)

    fl = open(self.addressL,'r')
    for line in fl:
      tmp = line[:-1].split()
      self.labelsets.append([int(i) for i in tmp])
    fl.close()

    tm = []
    for item in self.labelsets:
      tm = tm + item
    self.npLabelsets = np.array(tm)

  def genData(self,numPoints,bias,variance):
    self.genx = np.zeros(shape = (numPoints,2))
    self.geny = np.zeros(shape = numPoints)

    for i in range(0,numPoints):
      self.genx[i][0] = 1
      self.genx[i][1] = i
      self.geny[i] = (i + bias) + random.uniform(0,1) * variance

  def gradientDescent(self):
    xTrans = self.genx.transpose() #
    i = 0
    while i < self.numIterations:
      hypothesis = np.dot(self.genx,self.theta)
      loss = hypothesis - self.geny
      #record the cost
      self.cost.append(np.sum(loss ** 2))
      #calculate the gradient
      gradient = np.dot(xTrans,loss)
      #updata, gradientDescent
      self.theta = self.theta - self.alpha * gradient
      i = i + 1


  def show(self):
    print 'yes'

if __name__ == "__main__":
  c = dataMinning('c:\\city.txt','c:\\st.txt',np.ones(2),100000,0.000005)
  c.genData(100,25,10)
  c.gradientDescent()
  cx = range(len(c.cost))
  plt.figure(1)
  plt.plot(cx,c.cost)
  plt.ylim(0,25000)
  plt.figure(2)
  plt.plot(c.genx[:,1],c.geny,'b.')
  x = np.arange(0,100,0.1)
  y = x * c.theta[1] + c.theta[0]
  plt.plot(x,y)
  plt.margins(0.2)
  plt.show()
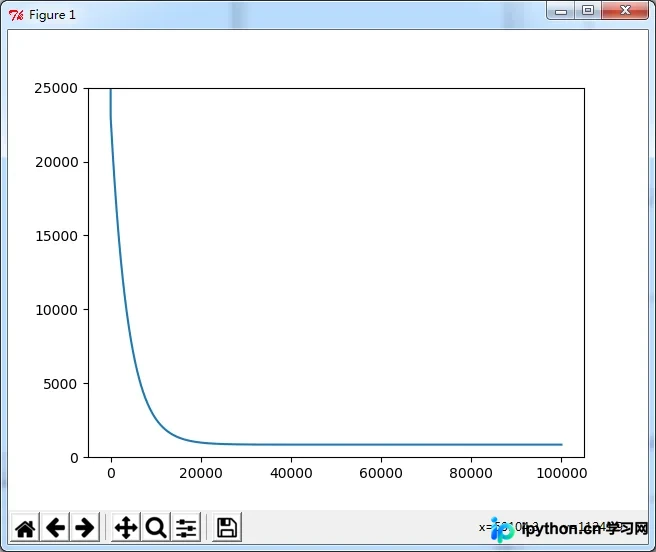
图1展示了迭代过程中误差(cost)的变化情况。
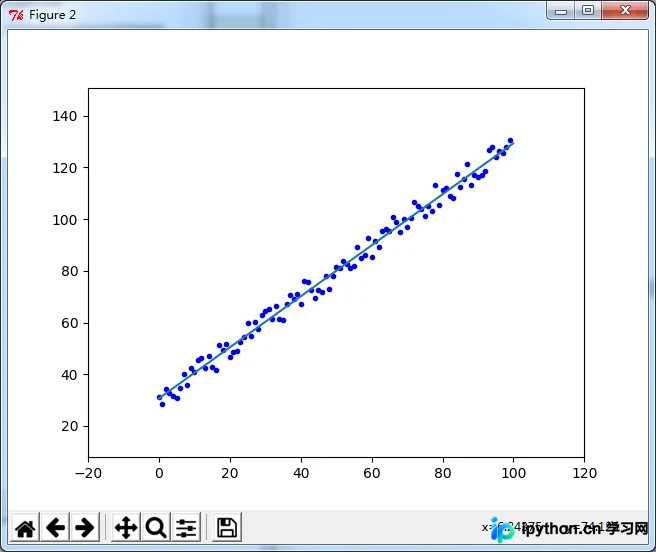
图2展示了数据散点分布以及拟合得到的直线。
总结部分。
以上是关于Python实现线性回归和批量梯度下降法代码实例的全部内容,希望对你有所帮助。感兴趣的朋友可继续查阅本站其他文章:
Python算法输出由1-9数组构成的结果为100的所有运算式
Python中实现k-means聚类算法的详细解析
Python编程实现粒子群算法(PSO)详解
如有不足之处,欢迎留言指正。感谢各位朋友对本站的支持!
本站声明
本文内容仅供参考,不代表本站观点。转载或引用请注明出处。如发现内容问题,请通过联系我们页面反馈。