Python数据分析代码案例:Pandas清洗与Matplotlib可视化

本篇教程以真实的电商销售脏数据为例,详细演示如何使用Pandas进行缺失值填充、日期标准化、文本去噪与异常过滤,并通过Matplotlib面向对象接口绘制专业双轴统计图与趋势图。
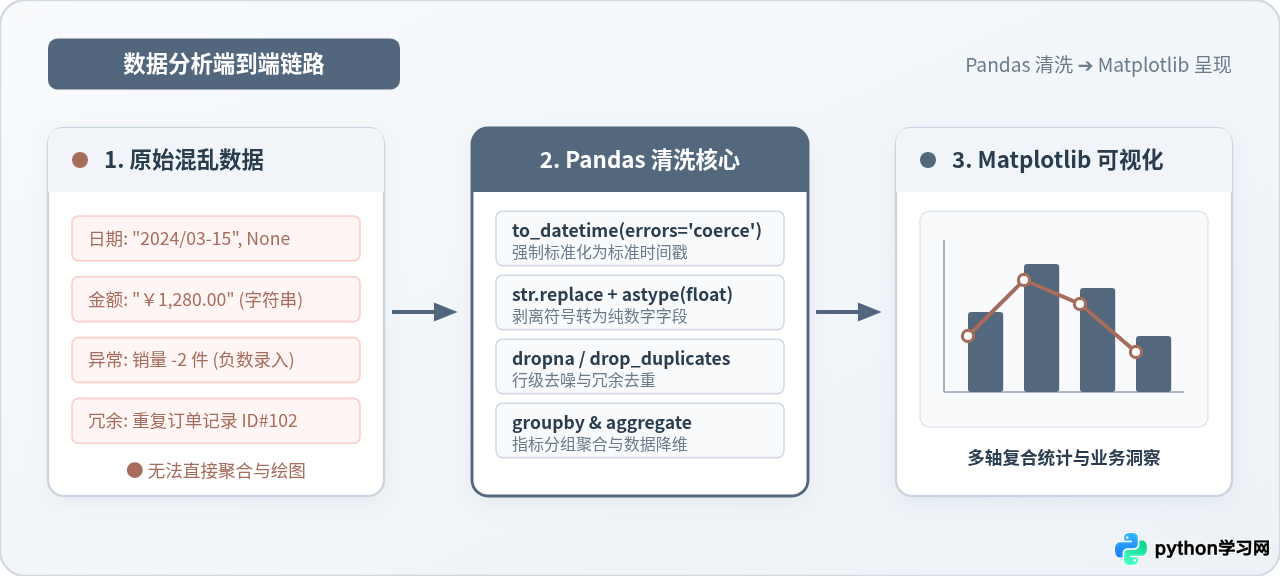
一、业务场景与脏数据集构建
很多数据分析教程往往依赖现成的标准化数据集(如鸢尾花数据集或小费数据集),这容易让初学者在面对真实业务环境时手足无措。在实际业务中,由于前端表单限制不严、多系统数据合并或人工手工录入,原始数据通常充满瑕疵。
为了还原最真实的清洗与分析过程,我们首先在 Python 中构造一个包含典型现实缺陷的销售订单表。该数据集包含订单号、下单时间、单价、购买数量与商品品类,共包含 10 条记录并埋伏了以下典型问题:
- 日期格式杂乱:混合了
"2024-03-01"、"2024/03/02"、中文格式"2024年03月03日"以及空值None; - 数值被存储为污染文本:单价列夹杂货币符号
¥和千分位逗号,,导致 Pandas 将其识别为通用对象(object)类型; - 主键重复:订单编号
1002重复录入; - 业务逻辑异常:存在购买数量为
-2件的不合理脏记录; - 维度缺失:部分记录的商品品类为
np.nan。
import pandas as pd
import numpy as np

# 构造包含典型缺陷的真实业务脏数据
raw_data = {
    'order_id': [1001, 1002, 1002, 1003, 1004, 1005, 1006, 1007, 1008, 1009],
    'order_date': [
        '2024-03-01', '2024/03/02', '2024/03/02', '2024年03月03日', None,
        '2024-03-04', '2024-03-05', '2024-03-05', '2024-03-06', '2024-03-07'
    ],
    'unit_price': [
        '¥1,200.00', '450.0', '450.0', '¥89.50', '¥3,200.00',
        '120.0', '¥2,100.00', '78.0', '¥560.00', '¥1,100.00'
    ],
    'quantity': [2, 1, 1, -2, 1, 3, 2, 5, 0, 2],
    'category': ['电子数码', '服饰鞋帽', '服饰鞋帽', '生鲜食品', '家居生活', None, '电子数码', '生鲜食品', '家居生活', '电子数码']
}

df = pd.DataFrame(raw_data)
print("--- 原始数据样本预览 ---")
print(df)
二、Pandas 数据缺陷探查与诊断
拿到任何陌生数据后,严禁直接开始计算指标或绘图。规范的流程是先进行三步基础诊断:类型核查、缺失统计和极值扫描。
运行 df.info() 可以发现,order_date 和 unit_price 均被标记为 object 类型。这代表 Pandas 将其视作普通字符串,此时不仅无法进行日期比较与重采样,也无法对单价执行加减乘除计算。同时,df.isnull().sum() 明确指出了日期与分类列均存在空值缺失。
df.describe() 默认只针对数值列计算统计量。此时检查 quantity 列的最小值(min),会立刻暴露 -2 和 0 的异常值,这在真实商品购买中显然属于退款脏数据或无意义记录,必须在业务过滤阶段处理。
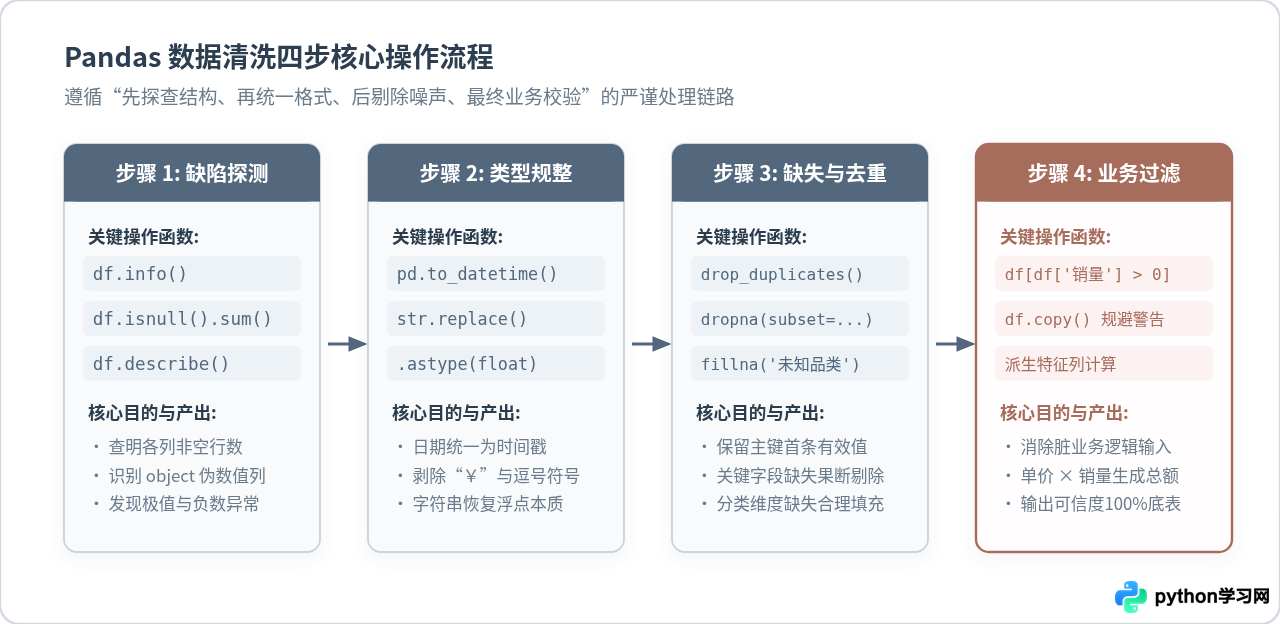
三、系统化数据清洗实操
根据诊断出的缺陷清单,我们按照标准化流程逐步执行清洗。每一步操作均采用矢量化方式进行,避免效率低下的 Python 原生循环。
1. 日期字段强制规整
面对混合斜杠、短横线与中文字符的日期字符串,直接使用 pd.to_datetime() 并搭配 errors='coerce' 参数。该参数的作用在于:一旦遇到无法解析的格式或非法字符,强制将其转化为 NaT(Not a Time),而不是抛出异常中断执行。
# 统一转换并处理非法日期
df['order_date'] = pd.to_datetime(
    df['order_date'].astype(str).str.replace('年', '-').str.replace('月', '-').str.replace('日', ''),
    errors='coerce'
)
2. 文本数值列的符号剥离与类型转换
单价字段中的 ¥ 和 , 是阻止数值转换的元凶。我们通过 Pandas 的字符串矢量接口 .str.replace() 剔除这些符号,随后通过 .astype(float) 转换恢复其浮点数本质:
# 清除货币符号与千分位逗号,转换为浮点型
df['unit_price'] = (
    df['unit_price']
    .str.replace('¥', '', regex=False)
    .str.replace(',', '', regex=False)
    .astype(float)
)
3. 重复值剔除与缺失值分类处理
业务中不同字段的缺失值处理策略截然不同:
- 主键重复:使用
df.drop_duplicates(subset=['order_id'], keep='first'),仅保留首条有效订单; - 关键时间戳缺失:缺少日期的订单无法归入时间序列分析,属于关键字段缺失,直接调用
df.dropna(subset=['order_date'])剔除整行; - 属性维度缺失:商品品类虽有缺失,但订单金额真实存在,若直接删行会导致销售总额失真,因此使用
df['category'].fillna('其他品类')进行填充归类。
4. 业务边界过滤与特征列派生
过滤掉销量小于等于 0 的脏记录后,务必调用 .copy() 方法生成独立副本,并重置行索引。随后计算派生字段 total_amount = unit_price * quantity:
# 剔除重复订单
df = df.drop_duplicates(subset=['order_id'], keep='first')

# 剔除日期缺失行,填充品类缺失值
df = df.dropna(subset=['order_date'])
df['category'] = df['category'].fillna('其他品类')

# 业务过滤:保留销售数量大于0的记录,使用 copy() 避免 SettingWithCopyWarning
clean_df = df[df['quantity'] > 0].copy()
clean_df.reset_index(drop=True, inplace=True)

# 派生特征:计算订单实际总金额
clean_df['total_amount'] = clean_df['unit_price'] * clean_df['quantity']
print("--- 清洗后的整洁数据表 ---")
print(clean_df[['order_id', 'order_date', 'category', 'unit_price', 'quantity', 'total_amount']])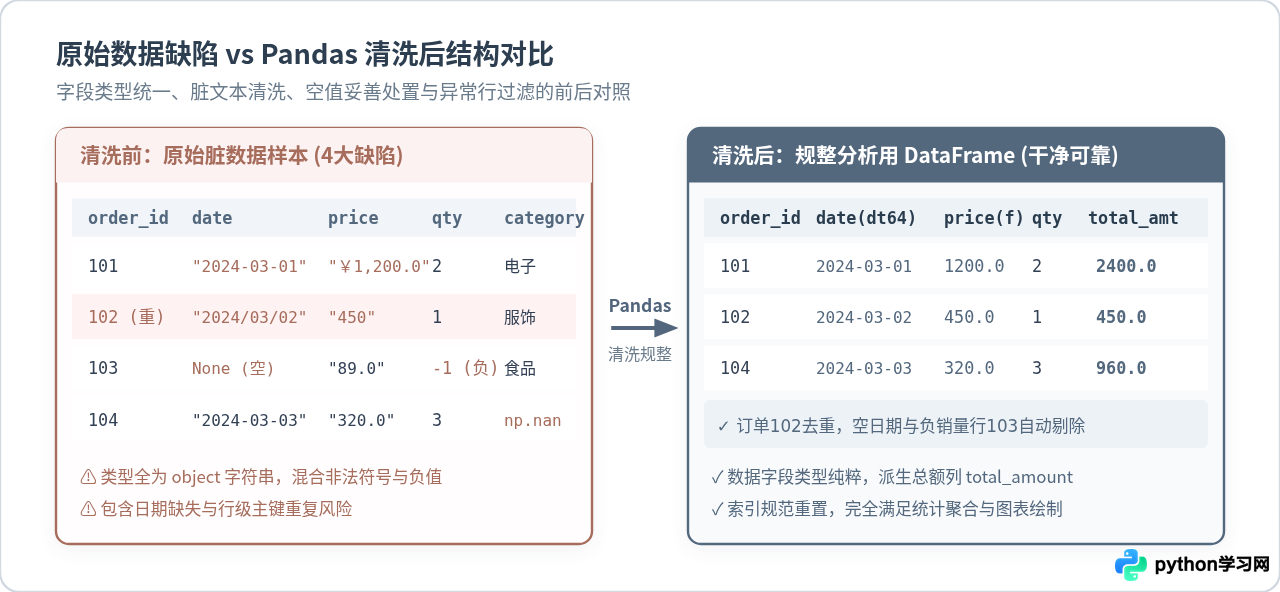
四、数据分组聚合计算
完成数据清洗后,底表结构清晰、数值纯正,可以直接进行统计聚合。为了满足后续多维图表的可视化需求,我们分别进行两个维度的聚合:
- 品类维度聚合:汇总各商品品类的销售总金额、总销售件数与平均客单价;
- 时间维度聚合:按日期汇总日销售额波动。
# 1. 品类维度聚合统计
category_summary = clean_df.groupby('category').agg(
    total_sales=('total_amount', 'sum'),
    total_quantity=('quantity', 'sum'),
    avg_price=('unit_price', 'mean')
).reset_index().sort_values(by='total_sales', ascending=False)

# 2. 日期维度趋势统计
daily_trend = clean_df.groupby('order_date').agg(
    daily_sales=('total_amount', 'sum')
).reset_index().sort_values(by='order_date')
五、Matplotlib 面向对象可视化实践
很多初学者习惯使用 plt.plot() 或 plt.bar() 进行过程式绘图。但在实际工程与多子图复杂排版中,过程式写法容易混淆当前的活动坐标轴。工业级代码推荐采用面向对象接口(Object-Oriented API),即通过 fig, ax = plt.subplots() 显式操控画布和子图对象。
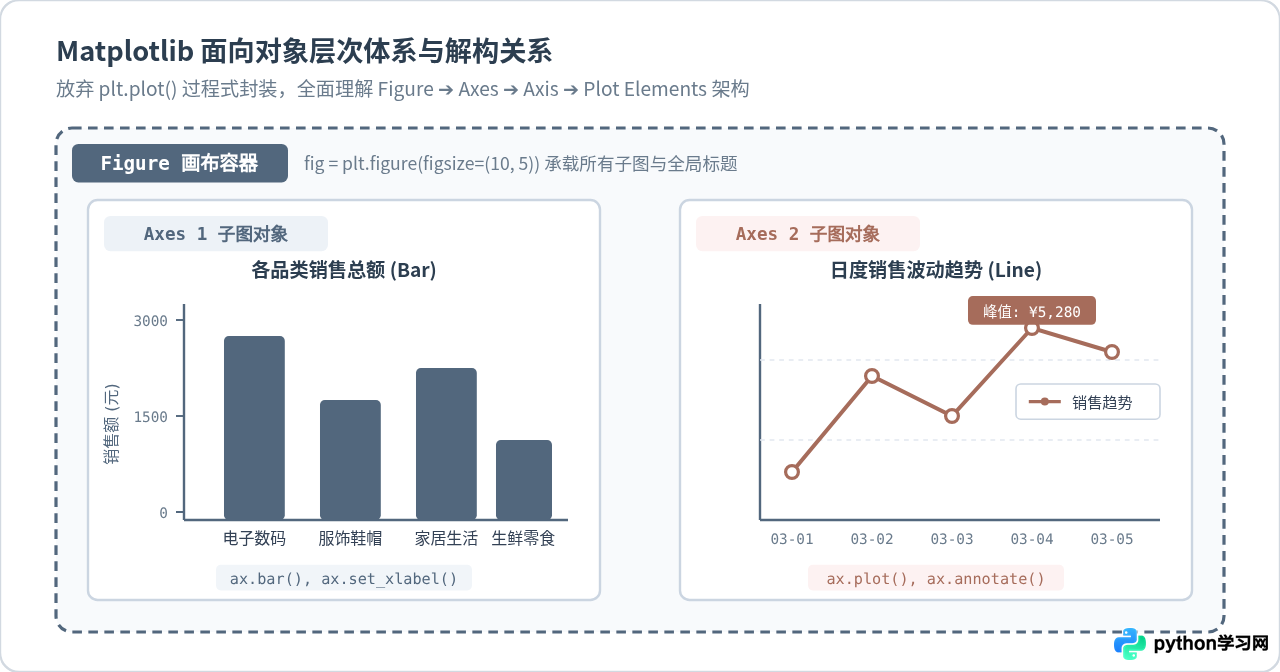
1. 解决中文显示方块与负号异常
Matplotlib 默认字体库不包含中文字形,若不显式指定,中文字符会全部渲染为白色空心方块(Tofu)。此外,Unicode 负号在某些字体下也会报错,需全局关闭 axes.unicode_minus:
import matplotlib.pyplot as plt

# 全局设置中文字体与负号正常显示
plt.rcParams['font.sans-serif'] = ['PingFang SC', 'Microsoft YaHei', 'SimHei', 'sans-serif']
plt.rcParams['axes.unicode_minus'] = False
2. 双子图协同绘制与美化设计
我们创建一个水平排列的双子图画布(1 行 2 列):
- 左子图(ax1):绘制品类销售总额的柱状图,并在柱子顶端动态标注具体金额标签;右侧次坐标轴叠加各品类订单件数折线,直观反映单价与件数的关系;
- 右子图(ax2):绘制每日销售额走势折线图,添加数据节点标记(marker),标注销售峰值日期与金额;
- 细节修饰:统一配色为工程蓝灰
#52677D与赭红#A66C5B,去掉多余的顶部和右侧外边框(spines),增加浅灰色虚线网格,提升数据信噪比。
# 创建面向对象画布 (1行2列)
fig, (ax1, ax2) = plt.subplots(1, 2, figsize=(14, 5.5), dpi=100)

# ----------------- 左图:品类销售与数量双轴图 -----------------
colors = ['#52677D', '#647D96', '#7D95AD', '#9CB1C4']
bars = ax1.bar(
    category_summary['category'],
    category_summary['total_sales'],
    color=colors[:len(category_summary)],
    width=0.45,
    label='销售额 (元)'
)

# 柱顶数值标注
for bar in bars:
    height = bar.get_height()
    ax1.annotate(f'¥{height:,.0f}',
                 xy=(bar.get_x() + bar.get_width() / 2, height),
                 xytext=(0, 4), textcoords="offset points",
                 ha='center', va='bottom', fontsize=9.5, color='#2C3E50', fontweight='bold')

# 次坐标轴:总销售件数折线
ax1_twin = ax1.twinx()
ax1_twin.plot(category_summary['category'], category_summary['total_quantity'],
              color='#A66C5B', marker='o', linewidth=2, label='销售件数 (件)')

ax1.set_title('各商品品类销售额与件数对比', fontsize=13, fontweight='bold', pad=12, color='#2C3E50')
ax1.set_ylabel('销售总金额 (元)', fontsize=10.5, color='#52677D')
ax1_twin.set_ylabel('销售件数 (件)', fontsize=10.5, color='#A66C5B')
ax1.set_ylim(0, category_summary['total_sales'].max() * 1.2)
ax1_twin.set_ylim(0, category_summary['total_quantity'].max() * 1.4)

# 边框与网格微调
ax1.spines['top'].set_visible(False)
ax1_twin.spines['top'].set_visible(False)
ax1.grid(axis='y', linestyle='--', alpha=0.35)

# ----------------- 右图:日度销售走势图 -----------------
# 格式化日期显示为 MM-DD
date_labels = daily_trend['order_date'].dt.strftime('%m-%d')
ax2.plot(date_labels, daily_trend['daily_sales'],
         color='#52677D', linewidth=2.2, marker='s', markersize=6, markerfacecolor='#FFFFFF', markeredgewidth=2,
         label='日销售额')

# 标注最高销售峰值点
max_row = daily_trend.loc[daily_trend['daily_sales'].idxmax()]
max_date_str = max_row['order_date'].strftime('%m-%d')
max_val = max_row['daily_sales']

ax2.annotate(f'峰值: ¥{max_val:,.0f}',
             xy=(max_date_str, max_val),
             xytext=(0, 15), textcoords="offset points",
             ha='center', va='bottom',
             arrowprops=dict(arrowstyle='->', color='#A66C5B', lw=1.5),
             fontsize=10, fontweight='bold', color='#A66C5B',
             bbox=dict(boxstyle='round,pad=0.25', facecolor='#FDF2F2', edgecolor='#A66C5B', lw=0.8))

ax2.set_title('日度销售总额趋势走向', fontsize=13, fontweight='bold', pad=12, color='#2C3E50')
ax2.set_xlabel('日期 (月-日)', fontsize=10.5, color='#52677D')
ax2.set_ylabel('销售总额 (元)', fontsize=10.5, color='#52677D')
ax2.set_ylim(0, max_val * 1.25)
ax2.spines['top'].set_visible(False)
ax2.spines['right'].set_visible(False)
ax2.grid(axis='y', linestyle='--', alpha=0.35)
ax2.legend(loc='upper right', frameon=True)

# 保证布局紧凑,杜绝标签与图例裁切
fig.tight_layout()
plt.savefig('sales_analysis.png', dpi=150, bbox_inches='tight')
plt.show()
六、完整独立端到端运行代码
为了让读者能够直接验证上述所有逻辑,以下提供整合后的完整独立 Python 脚本。你可以直接将代码保存为 run_analysis.py 并在本地环境中执行:
import pandas as pd
import numpy as np
import matplotlib.pyplot as plt

def main():
    # 1. 构建模拟数据
    raw_data = {
        'order_id': [1001, 1002, 1002, 1003, 1004, 1005, 1006, 1007, 1008, 1009],
        'order_date': [
            '2024-03-01', '2024/03/02', '2024/03/02', '2024年03月03日', None,
            '2024-03-04', '2024-03-05', '2024-03-05', '2024-03-06', '2024-03-07'
        ],
        'unit_price': [
            '¥1,200.00', '450.0', '450.0', '¥89.50', '¥3,200.00',
            '120.0', '¥2,100.00', '78.0', '¥560.00', '¥1,100.00'
        ],
        'quantity': [2, 1, 1, -2, 1, 3, 2, 5, 0, 2],
        'category': ['电子数码', '服饰鞋帽', '服饰鞋帽', '生鲜食品', '家居生活', None, '电子数码', '生鲜食品', '家居生活', '电子数码']
    }
    df = pd.DataFrame(raw_data)

    # 2. 数据清洗流水线
    # (a) 标准化日期
    df['order_date'] = pd.to_datetime(
        df['order_date'].astype(str).str.replace('年', '-').str.replace('月', '-').str.replace('日', ''),
        errors='coerce'
    )
    # (b) 清洗数值列字符串
    df['unit_price'] = (
        df['unit_price'].str.replace('¥', '', regex=False).str.replace(',', '', regex=False).astype(float)
    )
    # (c) 主键去重与空值处置
    df = df.drop_duplicates(subset=['order_id'], keep='first')
    df = df.dropna(subset=['order_date'])
    df['category'] = df['category'].fillna('其他品类')

    # (d) 业务有效性过滤并拷贝副本
    clean_df = df[df['quantity'] > 0].copy()
    clean_df.reset_index(drop=True, inplace=True)
    clean_df['total_amount'] = clean_df['unit_price'] * clean_df['quantity']

    # 3. 分组聚合计算
    cat_summary = clean_df.groupby('category').agg(
        total_sales=('total_amount', 'sum'),
        total_quantity=('quantity', 'sum')
    ).reset_index().sort_values(by='total_sales', ascending=False)

    daily_trend = clean_df.groupby('order_date').agg(
        daily_sales=('total_amount', 'sum')
    ).reset_index().sort_values(by='order_date')

    # 4. Matplotlib 面向对象绘图
    plt.rcParams['font.sans-serif'] = ['PingFang SC', 'Microsoft YaHei', 'SimHei', 'sans-serif']
    plt.rcParams['axes.unicode_minus'] = False

    fig, (ax1, ax2) = plt.subplots(1, 2, figsize=(13, 5), dpi=120)

    # 左图:柱状图与次轴折线
    bars = ax1.bar(cat_summary['category'], cat_summary['total_sales'], color='#52677D', width=0.45)
    for b in bars:
        h = b.get_height()
        ax1.annotate(f'¥{h:,.0f}', xy=(b.get_x() + b.get_width() / 2, h),
                     xytext=(0, 3), textcoords="offset points", ha='center', fontsize=9)

    ax1_twin = ax1.twinx()
    ax1_twin.plot(cat_summary['category'], cat_summary['total_quantity'], color='#A66C5B', marker='o', lw=1.8)
    ax1.set_title('各品类销售额与订单销量', fontsize=12, fontweight='bold', color='#2C3E50')
    ax1.set_ylabel('销售额 (元)', color='#52677D')
    ax1_twin.set_ylabel('销售件数 (件)', color='#A66C5B')
    ax1.spines['top'].set_visible(False)
    ax1_twin.spines['top'].set_visible(False)
    ax1.grid(axis='y', ls='--', alpha=0.3)

    # 右图:日销售额走势
    date_strs = daily_trend['order_date'].dt.strftime('%m-%d')
    ax2.plot(date_strs, daily_trend['daily_sales'], color='#52677D', marker='s', lw=2, markerfacecolor='white')
    max_idx = daily_trend['daily_sales'].idxmax()
    ax2.annotate('销售峰值',
                 xy=(date_strs.iloc[max_idx], daily_trend['daily_sales'].iloc[max_idx]),
                 xytext=(0, 15), textcoords="offset points", ha='center',
                 arrowprops=dict(arrowstyle='->', color='#A66C5B', lw=1.2),
                 color='#A66C5B', fontweight='bold', fontsize=9.5)

    ax2.set_title('日度销售额走向趋势', fontsize=12, fontweight='bold', color='#2C3E50')
    ax2.set_ylabel('销售额 (元)', color='#52677D')
    ax2.spines['top'].set_visible(False)
    ax2.spines['right'].set_visible(False)
    ax2.grid(axis='y', ls='--', alpha=0.3)

    fig.tight_layout()
    plt.savefig('sales_analysis.png', dpi=150, bbox_inches='tight')
    print("可视化报表已保存为 sales_analysis.png")

if __name__ == '__main__':
    main()
七、数据分析全流程避坑总结
回顾从原始数据加载到最终图表落地的全过程,高效的数据分析并非单纯调用几个 API,而是要在每一个环节树立防御性编程意识。
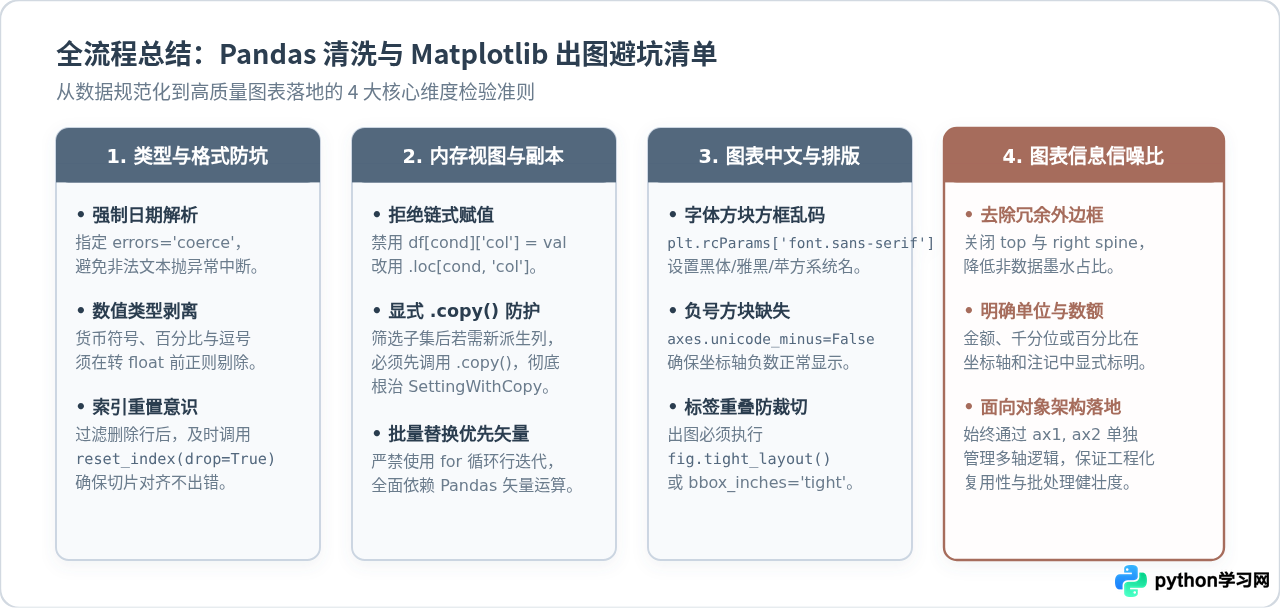
- 类型早定型:数据加载后的首要任务是把时间转为标准
datetime64、把金额转为float。绝不要带着object类型的数值列进入下一步计算; - 警惕切片警告:在对 DataFrame 进行行过滤时,务必养成后接
.copy()的习惯,彻底切断底层数组视图的关联,避免触发臭名昭著的SettingWithCopyWarning; - 面向对象出图:尽量抛弃过程式的
plt.title()、plt.plot(),全面采用fig, ax = plt.subplots()搭配ax.set_title()等显式方法,保证图表组件层次分明、易于拓展和自动化批量产出。
本站声明
本文内容仅供参考,不代表本站观点。转载或引用请注明出处。如发现内容问题,请通过联系我们页面反馈。